EQL Projects
Hypoxia Monitoring
 The nearshore region of Long Bay, South Carolina, has been the site of a growing number of hypoxic events primarily during summer months. Hypoxic events are those in which dissolved oxygen (DO) < 2 mg/L. Although anecdotal evidence exists for earlier hypoxic events, researchers and resource managers documented low DO immediately adjacent to the shoreline in the summer of 2004. From July 15 to July 22, 2004, surveys from a number of piers in 7 m. water depth indicated a stratified water column and bottom water DO concentrations < 2 mg/L. Exceptionally high catches of flounder, a bottom fish, were reported off the Grand Strand’s recreational fishing piers during this time, while catch rates of most other species declined abruptly. Fishermen reported that the flounder were lethargic and often caught in the surf zone. This hypoxic event prompted the creation of a workgroup of researchers and resource managers, the Long Bay Working Group, to study available data pertaining to this event. An examination of meteorological data revealed that hypoxia occurred during a period of upwelling-favorable winds that coincided with “anomalous” water-cooling and a stratified water column, suggesting the importance of physical forcing.
A multi-disciplinary approach has been established to gain additional insight into future hypoxic conditions by: (1) continuing nearshore water quality monitoring (salinity, temperature, DO) and expanding this monitoring to include 222Rn (a tracer of groundwater inputs) and chlorophyll, CDOM, and turbidity; (2) examining the biological response (productivity) during times of enhanced nutrient input and low DO levels; and (3) analyzing prior and newly collected data to better understand the interconnection between offshore and onshore driving forces.
 Based on monitoring conducted since 2006 and various companion research efforts, the Long Bay Working Group has developed the following working hypothesis to explain why Long Bay is experiencing periods of hypoxia and anoxia. During the summer, southwesterly winds combine with solar heating to create oceanographic conditions that limit mixing of the nearshore waters, keeping them close to shore. This constrained mixing is most pronounced where Long Bay is most convex - the location of the Grand Strand. The mixing rate of the coastal waters is now being measured through continuous radon measurements.
When mixing with offshore waters is sluggish, nutrients and organic matter are confined to a nearshore region where they stimulate aerobic respiration and hence the removal of O2 by marine bacteria. The exact sources of the nutrients and organic matter and mechanisms by which they stimulated microbial uptake of O2 are a matter of active research. Sources currently being investigated include submarine groundwater discharge through the beach face and export from tidal swashes. Tides and longshore currents are thought to play an important role in the development of hypoxia, as they resuspend particles from the seafloor, churning them into the overlying waters where they are more readily available for microbial attack.
 An important finding is a nearly continuous enrichment of phytoplankton and particulate matter in the bottom waters. Some evidence suggests that the biomass of phytoplankton is insufficient to provide enough organic matter to support the observed O2 deficit. This is contrary to what occurs in other dead zones, where algal overgrowth is well documented, and suggests a unique aspect to the underlying causes of hypoxia in Long Bay.
A preliminary assessment of the impact of low O2 on the marine life of Long Bay is being conducted by monitoring larval recruitment onto ceramic plates suspended from the piers. Since no similar data have been collected, a baseline will have to be established to compare larval recruitment success under periods of oxic versus hypoxic conditions.
For more information, you can read a more detailed project overview and find a link to both our real-time and historical data here.
You can view a presentation about this project in Hypoxia in the nearshore coastal waters of South Carolina along the Grand Strand (pdf).
You can learn more about the design, construction, and maintainence of our pier-based ocean monitoring platforms in New Approaches to Pier-based Ocean Monitoring Platforms (pdf).
Photos from the Piers
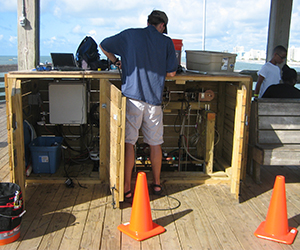
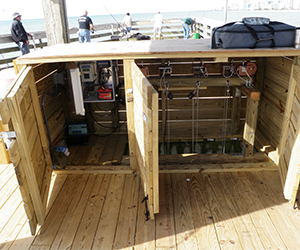 Instrumentation box at 2nd Avenue Pier containing water quality monitoring system. Deck support structure visible with winches and cables connected to anchoring system positioned on the sea floor. Water monitoring equipment rides on copper pipe sleds up and down the cables for secure deployment and easy retrieval for routine maintenance. We have two similar set-ups at Apache Pier and Cherry Grove Pier. Instrumentation box at 2nd Avenue Pier containing water quality monitoring system. Deck support structure visible with winches and cables connected to anchoring system positioned on the sea floor. Water monitoring equipment rides on copper pipe sleds up and down the cables for secure deployment and easy retrieval for routine maintenance. We have two similar set-ups at Apache Pier and Cherry Grove Pier. |
|
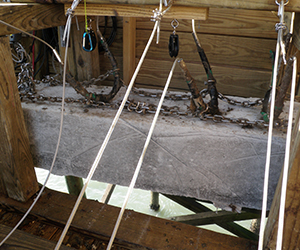 Concrete anchor with stainless steel chain and bent stainless steel pipes. The chain holds the spacing of the bent pipes and the bent pipes keep the spacing of the cables that the monitoring equipment runs on. The bent pipes maintain stabilization of monitoring equipment and enable adjustment of cable tension for changing conditions. Concrete anchor with stainless steel chain and bent stainless steel pipes. The chain holds the spacing of the bent pipes and the bent pipes keep the spacing of the cables that the monitoring equipment runs on. The bent pipes maintain stabilization of monitoring equipment and enable adjustment of cable tension for changing conditions. |
|
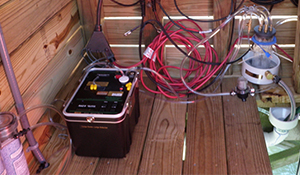 Radon system (desiccant cartridges, Durridge RAD 7 and spray chamber). A pump positioned just above the seafloor pulls bottom water to the deck and deposits it into a spray chamber. The RAD7 pulls the air from the top of the spray chamber, through a desiccant to remove moisture and into the unit to measure Radon. Radon system (desiccant cartridges, Durridge RAD 7 and spray chamber). A pump positioned just above the seafloor pulls bottom water to the deck and deposits it into a spray chamber. The RAD7 pulls the air from the top of the spray chamber, through a desiccant to remove moisture and into the unit to measure Radon. |
|
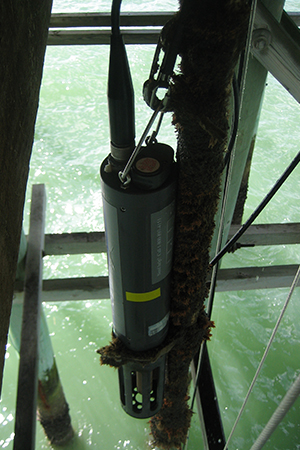 YSI 6600 multiparameter water quality sonde measuring temperature, dissolved oxygen, pH, conductivity, chlorophyll and turbidity just below the water surface and just above the seafloor. YSI 6600 multiparameter water quality sonde measuring temperature, dissolved oxygen, pH, conductivity, chlorophyll and turbidity just below the water surface and just above the seafloor. |
|
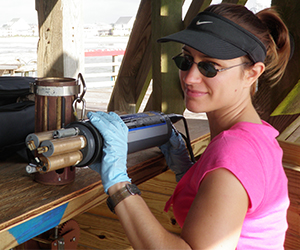
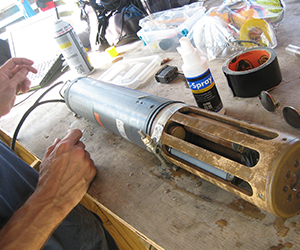 Routine maintainance for the YSI 6600. Routine maintainance for the YSI 6600. |
|
 Biofouling on the YSI 6600 – we regularly clean off these probes to ensure that we are collecting sound data. Biofouling on the YSI 6600 – we regularly clean off these probes to ensure that we are collecting sound data. |
|
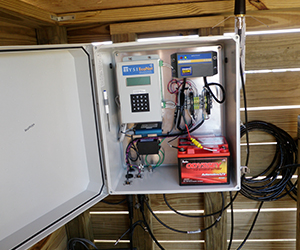 EcoNet Web-Enabled Datalogger that sends continuous real-time water quality and meteorological data to our server. You can access the data here. EcoNet Web-Enabled Datalogger that sends continuous real-time water quality and meteorological data to our server. You can access the data here. |
|
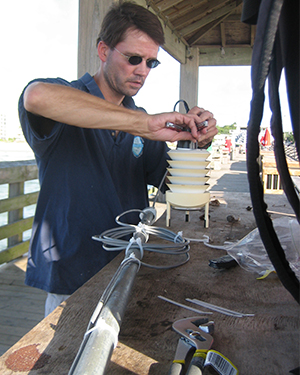 Building the weather station. Building the weather station. |
|
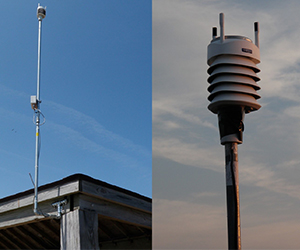 Weather station up and running measuring temperature, relative humidity, barometric pressure, wind speed and wind direction. Weather station up and running measuring temperature, relative humidity, barometric pressure, wind speed and wind direction. |
|
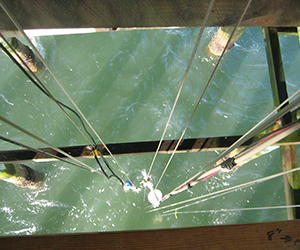 Normal water color at the pier. Normal water color at the pier. |
|
Water color during an algal bloom at the pier.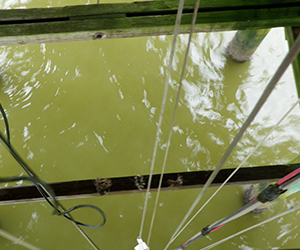 |